← Back to Selected Work
04 — Xshield · ColorTokens · 2020–2021

Making the Invisible
Network Visible.

How I turned a table-driven security console into a network-first experience — helping engineers move from seeing a risk to understanding, validating, and acting on it.

My Role
Founding UX Architect
Team
1 UX · 1 VX
Timeline
4–6 Months → Production
Scope
Strategy · Architecture · Interaction Design · Executive Influence
Cybersecurity Enterprise SaaS Data Visualisation 0 → 1
Strategic Context

Network security had become a relationship problem,
not a data problem.

As networks moved to hybrid cloud, the perimeter was no longer a sufficient security boundary. Security teams had more traffic data than ever — but turning that data into confident policy remained largely manual.

The market still relied on
Tables Log dashboards CLI tools Raw flows
What engineers still had to do themselves
Construct meaning from raw flows
Map relationships across disconnected tools
Hold the network topology in their head
Guess what a policy would affect
The old question
"How do we show engineers more network data?"
The real question
"How do we help engineers move from seeing traffic to confidently controlling it — without breaking production?"
Why now
Zero Trust shift — security moved from perimeter to containing lateral movement.
Hybrid cloud sprawl — workloads distributed across environments, far more complex.
Market of consoles — every competitor was still in the table-and-dashboard paradigm.
The Challenge

Four problems.
One compounding failure.

Customer interviews and research revealed four distinct but entangled problems. Each made the others worse.

2–4 wks
to identify an unauthorized connection
Manual traffic analysis, correlating raw logs across disconnected tools
4 wks
to author a policy
Identify assets, map ports and protocols, write and validate rules by hand
2+ wks
to build confidence before enforcement
Manual dependency checks and cross-team coordination before enforcing
01
Visibility
No unified, real-time view of network relationships. Unauthorized activity was buried in traffic data.
02
Complexity
Powerful tools, but no clear path from "I see a problem" to "I fixed the problem."
03
Speed
Identifying assets, mapping ports, creating groups — every step was separate and manual.
04
Confidence
Engineers hesitated to enforce policy because they couldn't see what else it might affect.

Security teams didn't lack information. They lacked a system that could turn information into a confident decision.

The Shift

From a table of rows
to a map of relationships.

The old product had the right data — assets, connections, policies, logs. What it didn't have was a way to move from data → understanding → action.

That wasn't a UI problem.
It was a paradigm problem.

I challenged the assumption that Xshield needed to be another security dashboard. I made the case to the CPO and CEO that the network itself should become the interface — then validated the direction with a working prototype and usability testing before production development.

The old workflow — 7 cognitive transitions, all in the engineer's head
01
Open Flow Explorer
→
02
Scan rows for unauthorized traffic
→
03
Note IPs, ports, protocols
→
04
Navigate to the workload
→
05
Find or create a group
→
06
Open Policy Builder
→
07
Reconstruct from notes

Every transition was technically possible. The relationship between them existed only in the engineer's head.

What changed
Tables of rows
→
Network map — relationships at a glance
Data first
→
Mental model first
7 disconnected tools
→
One continuous flow
Guess what policy affects
→
See impact before enforcing
Dashboard at all costs
→
Network itself becomes the interface
The new interaction model
01
See
→
02
Understand
→
03
Validate
→
04
Act
Design Strategy

Three beliefs shaped
the new experience.

01

Show What Matters

Surface what requires attention. Threat state should be understandable before an engineer reads the underlying data.

02

Act Where You See

Put the action next to the context. If an engineer sees suspicious traffic, they shouldn't have to leave that view to create a policy.

03

Confidence Before Enforcement

Security actions have consequences. Engineers should understand a policy's expected impact before it goes live.

The Product

The network becomes
the interface.

A spatial, relationship-first view of the network — bringing asset groups, traffic flows and threat signals together on one continuous surface.

01
Select a node
→
02
See its relationships
→
03
Understand the risk
→
04
Create a policy
→
05
Preview its impact
→
06
Validate
→
07
Enforce
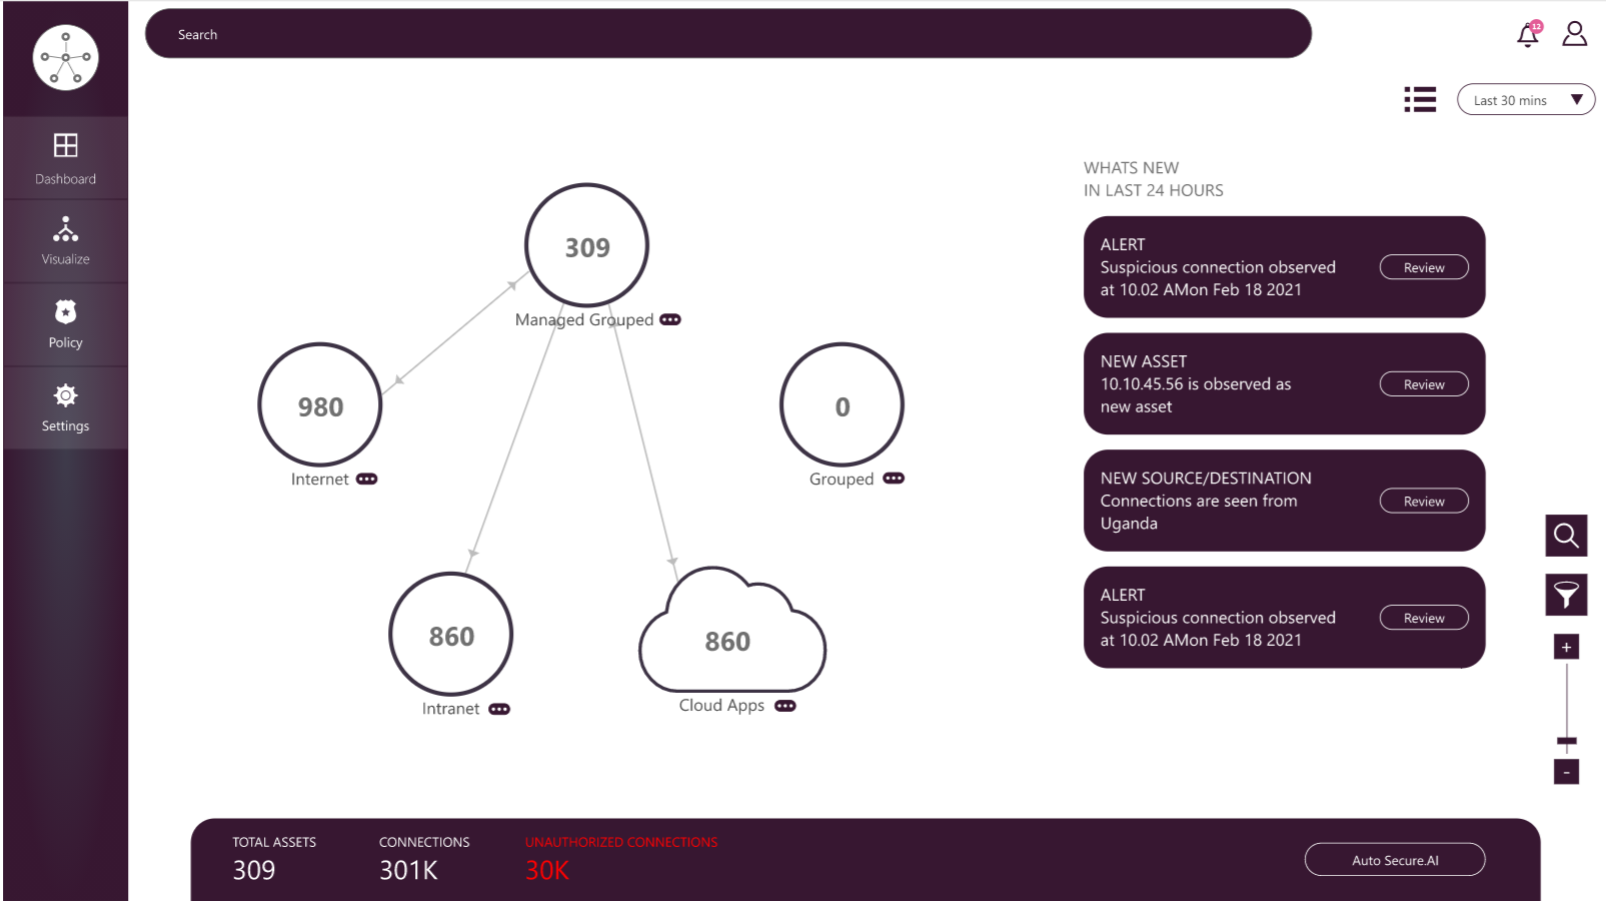
Xshield network map — visual V1 purple dashboard
Network Map

Asset groups arranged spatially. Traffic flows encoded by direction and authentication status. Threat signals ambient — legible before any data is read.

Impact

From weeks of friction
to hours of confidence.

10×
Faster threat identification
2–4 weeks → hours
Manual log correlation replaced by the network map
Customer interviews · post-launch
75%
Reduction in policy authoring time
4 weeks → under 1 week
Disconnected steps collapsed into one continuous flow
Customer interviews · post-launch
0 → 1
Product paradigm shift
Validated with security practitioners through prototype testing before a line of production code was written
Usability testing · CPO sign-off

Impact figures are directional signals drawn from customer interviews and usability research, not broad causal claims.

← Back to Selected Work Next Case Study →